Monte Carlo availability and capacity ramp-up studies in software
By Sidney Santos and Lucas Espindola · · 7 min read
Part 2 of the series “Engineering simulation as software”: Part 1 · Part 2 · Part 3
Industry news
Transcribed from Pipelines International, March 2016, as “Real-time demand for a gas pipeline design: dealing with modern challenges – Part 2”. Company names have been removed from this transcription; the original PDF is linked at the top and bottom of this post.
Following-on the previous article on this subject published in the December 2015 issue of Pipelines International, this article presents new functionalities of the GasPipelineDesign and GasPipelineExpansion mobile applications as part of the innovative mobile technology that has been developed to support gas pipeline design through the web.
The availability to study the compression system and the optimum capacity ramp-up of a transmission system are the new functionalities of the application, and are of key importance in the process of designing a feasible gas pipeline project.
Innovative technology
Following the approach presented in the previous article, we have implemented new features in the GasPipelineExpansion application, which are described here through a case study that highlights the application's capabilities.
The application has been designed to:
- Perform cost estimates for new gas pipeline projects or capacity expansions of existing projects;
- Allows the addition of compressor stations to an existing project, undertake capacity ramp-up and availability studies; and,
- Work with GIS information (latitude, longitude, and elevation profile) for the pipeline route.
New project or capacity expansion
Where transmission or distribution companies see an opportunity to increase the system's capacity, GasPipelineDesign and GasPipelineExpansion can be used together to provide the best feasible solution for the expansion project, be it construction of a loop pipeline, compressor station(s), or a pipeline interconnection.
Capacity ramp-up
New gas pipeline projects generally do not start operation with full capacity and it is necessary to determine the best configuration for compressor stations and compressor units to cope with the capacity ramp-up through the first years of operation, along with the schedule for installation of compressor stations and compressor units. The GasPipelineExpansion approach optimises CAPEX cash flow and makes the project more competitive.
Availability study
GasPipelineExpansion incorporates a powerful and flexible module for an availability study that performs Monte Carlo simulations. Compressor unit failures, their frequency and scenarios, are identified and each scenario is thermos-hydraulically simulated and its capacity under failure is quantified. The frequency of failures versus capacity under failure will allow the evaluation of the compressor-system availability, and also support decisions on the provision of an adequate level of redundancy (stand-by units) for gas pipelines. The simulation process can be as follows:
- Simulate the compression system without any stand-by units and obtain the availability.
- Select target compressor stations to have stand-by units, and re-run the simulation to obtain an improved availability for the system.
- Continue testing other arrangements of stand-by units until the availability satisfies the project's needs.
- Alternatively, simulate using a stand-by unit for all the compressor stations and compare the outcomes.
Electric Power Research Institute (EPRI) [1] has surveyed many compressor stations with different arrangements of compressor (centrifugal or reciprocating) and driver (electric motor, gas turbine, or gas motor) and identified reliability and availability values in Table 1.
| Arrangement | Reliability (%) | Availability (%) |
|---|---|---|
| Electric motor + centrifugal | 99.4 | 98.9 |
| Gas turbine + centrifugal | 98.2 | 97.1 |
| Gas motor + reciprocating | 97.1 | 94.3 |
Table 1: The reliability and availability values of different compressor station arrangements as surveyed by the Electric Power Research Institute.
The simulation runs 100,000 iterations and compiles groups of failure results with their respective gas-transmission capacity and frequency. The application can handle different sizes and types of compressor units at any compressor station, with each unit having its own availability figures. An availability study using a Monte Carlo simulation is of key importance for a feasible gas pipeline project. Transmission companies must mitigate their operational risk to comply with their transportation agreements with local distribution companies or end users with regard to firm-capacity clauses and related penalties for non-compliance. In the event of a compressor unit's failure impacting the pipeline capacity, the transmission company would face penalties and loss of revenue, dramatically impacting its economic result [2-5].
Compressor unit failures, their frequency and scenarios, are identified and each scenario is thermos-hydraulically simulated and its capacity under failure is quantified.
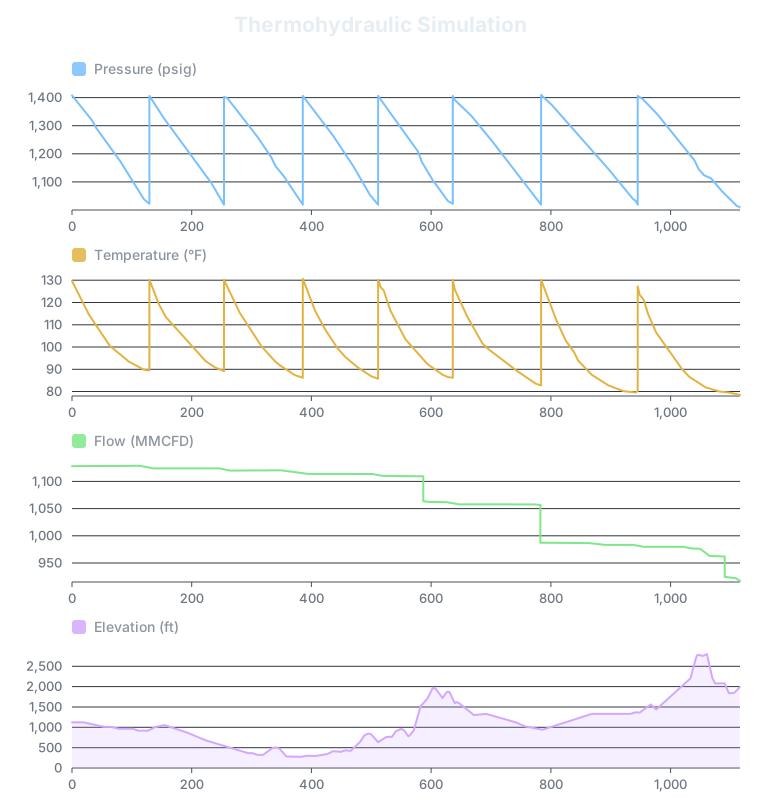
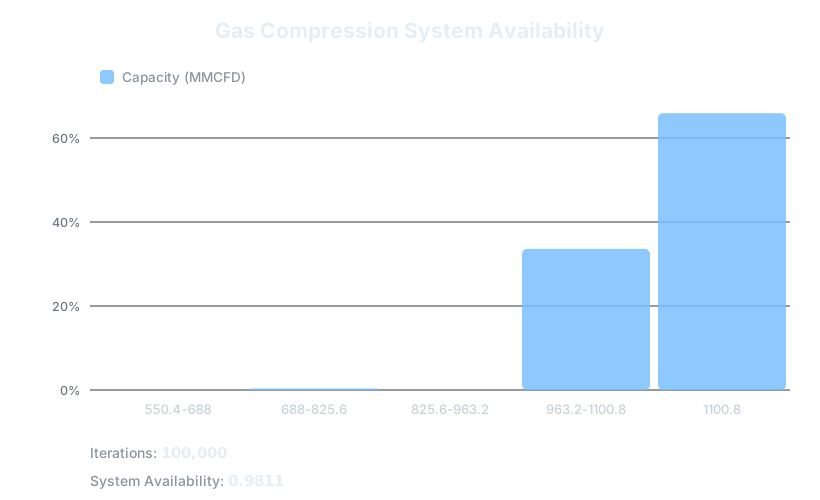
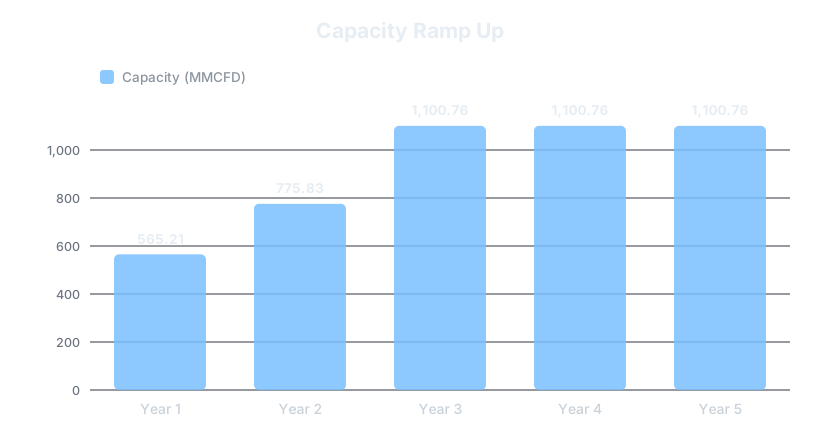
Above: The graphical result of a GasPipelineExpansion thermohydraulic simulation (left) showing a availability analysis without a stand-by compressor units, and the results of a capacity ramp-up study (right) with one compressor station (year 1), three compressor stations (year 2), and seven compressor stations (years 3 to 30).
Case study: GASBOL pipeline
The case study used to illustrate this article is based on the GASBOL pipeline project if it was being designed now. Based on the prevailing market condition and technical and economic assumptions at the time it was designed – around 1995 – the main section of the project has a nominal diameter of 32 inches and 14 compressor stations. The transmission capacity is 1,059 MMcf/d.
With the same technical requirements and today's economic assumptions, and by using this technology, the best alternative for the project is as follows:
(a) Technical assumptions:
- Capacity: 1,059 MMcf/d
- Length: 1,068 miles (straight route)
- Length: 1,118 miles (geographic route)
- MAOP: 1,420 psi
- Pipe material: API 5L X-80
- Gas specific gravity: 0.6000
- Inlet pressure: 1,410 psig
- Delivery pressure: 1,000 psig
- Compression ratio: 1.4000
- Gas deliveries, MMcf/d: D1, at milepost 363.4 miles: 1.7657; D2, at milepost 589.3 miles: 47.6748; D3, at milepost 781.6 miles: 68.8636; D4, at milepost 877.1 miles: 2.8252; D5, at milepost 1025.1 miles: 14.1259; D6, at milepost 1092.5 miles: 40.2587; D7, at milepost 1104.3 miles: 5.6503
(b) Economic assumptions:
- Pipe material cost: US$2,500/ton
- Fuel gas cost: US$5/MMBTU
- Pipeline operation and maintenance cost: 1.5 per cent of pipeline CAPEX per year
- Compressor station operation and maintenance cost: 5 per cent of compressor station CAPEX per year
- Project economic life: 30 years
- Discount rate: 12% per year
- Construction time: 4 years
- Pipeline CAPEX schedule: 15% year 1, 30% year 2, 30% year 3, 25% year 4
- Compressor station CAPEX schedule: 0% year 1, 10% year 2, 40% year 3, 50% year 4
Results for the selected gas pipeline configuration:
(a) Technical:
- Nominal diameter: 36 inches
- Total length: 1,118 miles
- Transmission capacity: 1,100.76 MMcf/d
- Number of compressor stations: 7
- Number of operating units per compressor station: 2
- Number of stand-by units per compressor station: 1
- Total required power: 125,144 hp
- Total installed power: 298,812 hp
- Total required fuel gas per year: 9,517.08 MMcf
- Compressor system availability: without stand-by units: 0.9811; with one stand-by unit at CS# 4: 0.9836; with stand-by units at CS# 2, 4, and 6: 0.9925; with stand-by units at all CS: 0.9997
- Capacity ramp-up: with one compressor station (CS# 4): 565.21 MMcf/d; with three compressor stations (CS# 2,4,6): 775.83 MMcf/d; with seven compressor stations (CS# 1,2,3,4,5,6,7): 1,100.76 MMcf/d
(b) Economic (in MM US$):
- Pipeline total cost: 3,528.48
- Pipeline total cost present value: 2,630.48
- Compressor station total cost: 800.55
- Compressor station total cost present value: 546.13
- Pipeline operation and maintenance present value: 270.95
- Compressor station operation and maintenance present value: 204.91
- Total fuel gas present value: 237.26
- Inventory (line pack) gas present value: 11.01
- Total CAPEX: 3,176.61
- Total OPEX: 724.13
- Total Project PV: 3,900.73
Conclusion
This technology covers all the important aspects related to the design process for a gas pipeline, including thermos-hydraulics, failure analysis with Monte Carlo simulation, capacity ramp-up, cost assessment, and economics. This state-of-the-art, innovative mobile technology improves productivity for gas pipeline conceptual design with simple, practical, accurate, reliable, and speedy solutions.
References
- Electric Power Research Institute, 1999. Report No. RP 4CH2983.
- S.P.Santos, 2009. Monte Carlo simulation – a key for a feasible gas pipeline design. Pipeline Simulation Interest Group, Galveston, TX, USA.
- S.P.Santos, 2008. Availability and risk analysis effects on gas pipeline tariff making. International Pipeline Conference, 2008, Calgary, Canada.
- S.P.Santos, M.A.S.Bittencourt, and L.D.Vasconcellos, 2006. Compressor station availability – managing its effects on gas pipeline operation. International Pipeline Conference, Calgary, Canada.
- S.P.Santos and E.Saliby, 2003. Compression service contracts – when is it worth it? Pipeline Simulation Interest Group, Bern, Switzerland.
Originally published in Pipelines International, March 2016, as “Real-time demand for a gas pipeline design: dealing with modern challenges – Part 2”. Original PDF.